Geo2SigMap turns geographical information into physically accurate digital twins, which can then be used to generate synthetic ray tracing datasets and train ML models for signal coverage prediction.
Overview
Welcome to the Geo2SigMap, an efficient framework for high-fidelity RF signal mapping leveraging geographic databases, ray tracing, and a novel cascaded U-Net model. Geo2SigMap features a scalable, automated pipeline that efficiently generates 3D building and path gain (PG) maps via the integration of a suite of open-sourced tools, including OpenStreetMap (OSM) and NVIDIA's Sionna RT. Geo2SigMap also features a cascaded U-Net model, which is pre-trained on pure synthetic datasets leveraging the building map and sparse signal strength (SS) map as input to predict the full SS map for the target (unseen) area. The performance of Geo2SigMap has been evaluated using large-scale field measurements collected using three types of user equipment (UE) across six LTE cells operating in the citizens broadband radio service (CBRS) band deployed on the Duke University West Campus. Our results show that Geo2SigMap achieves significantly improved root-mean-square error (RMSE) in terms of the SS map prediction accuracy compared to existing baseline methods based on channel models and ML.
The current version of the codebase (v1.0.0) consists of two main components:
- Scene Generation: A pure Python-based pipeline for generating 3D scenes for arbitrary areas of interest. This new Python-based pipeline replaces the scene generation pipeline used in our DySPAN'24 paper and is more scalable, efficient, and user-friendly.
- ML-based Propagation Model: ML-based signal coverage prediction using the pre-trained model based on the cascaded U-Net architecture, also described in our DySPAN'24 paper.
1: Scalable 3D Scene Generation for Arbitrary Areas
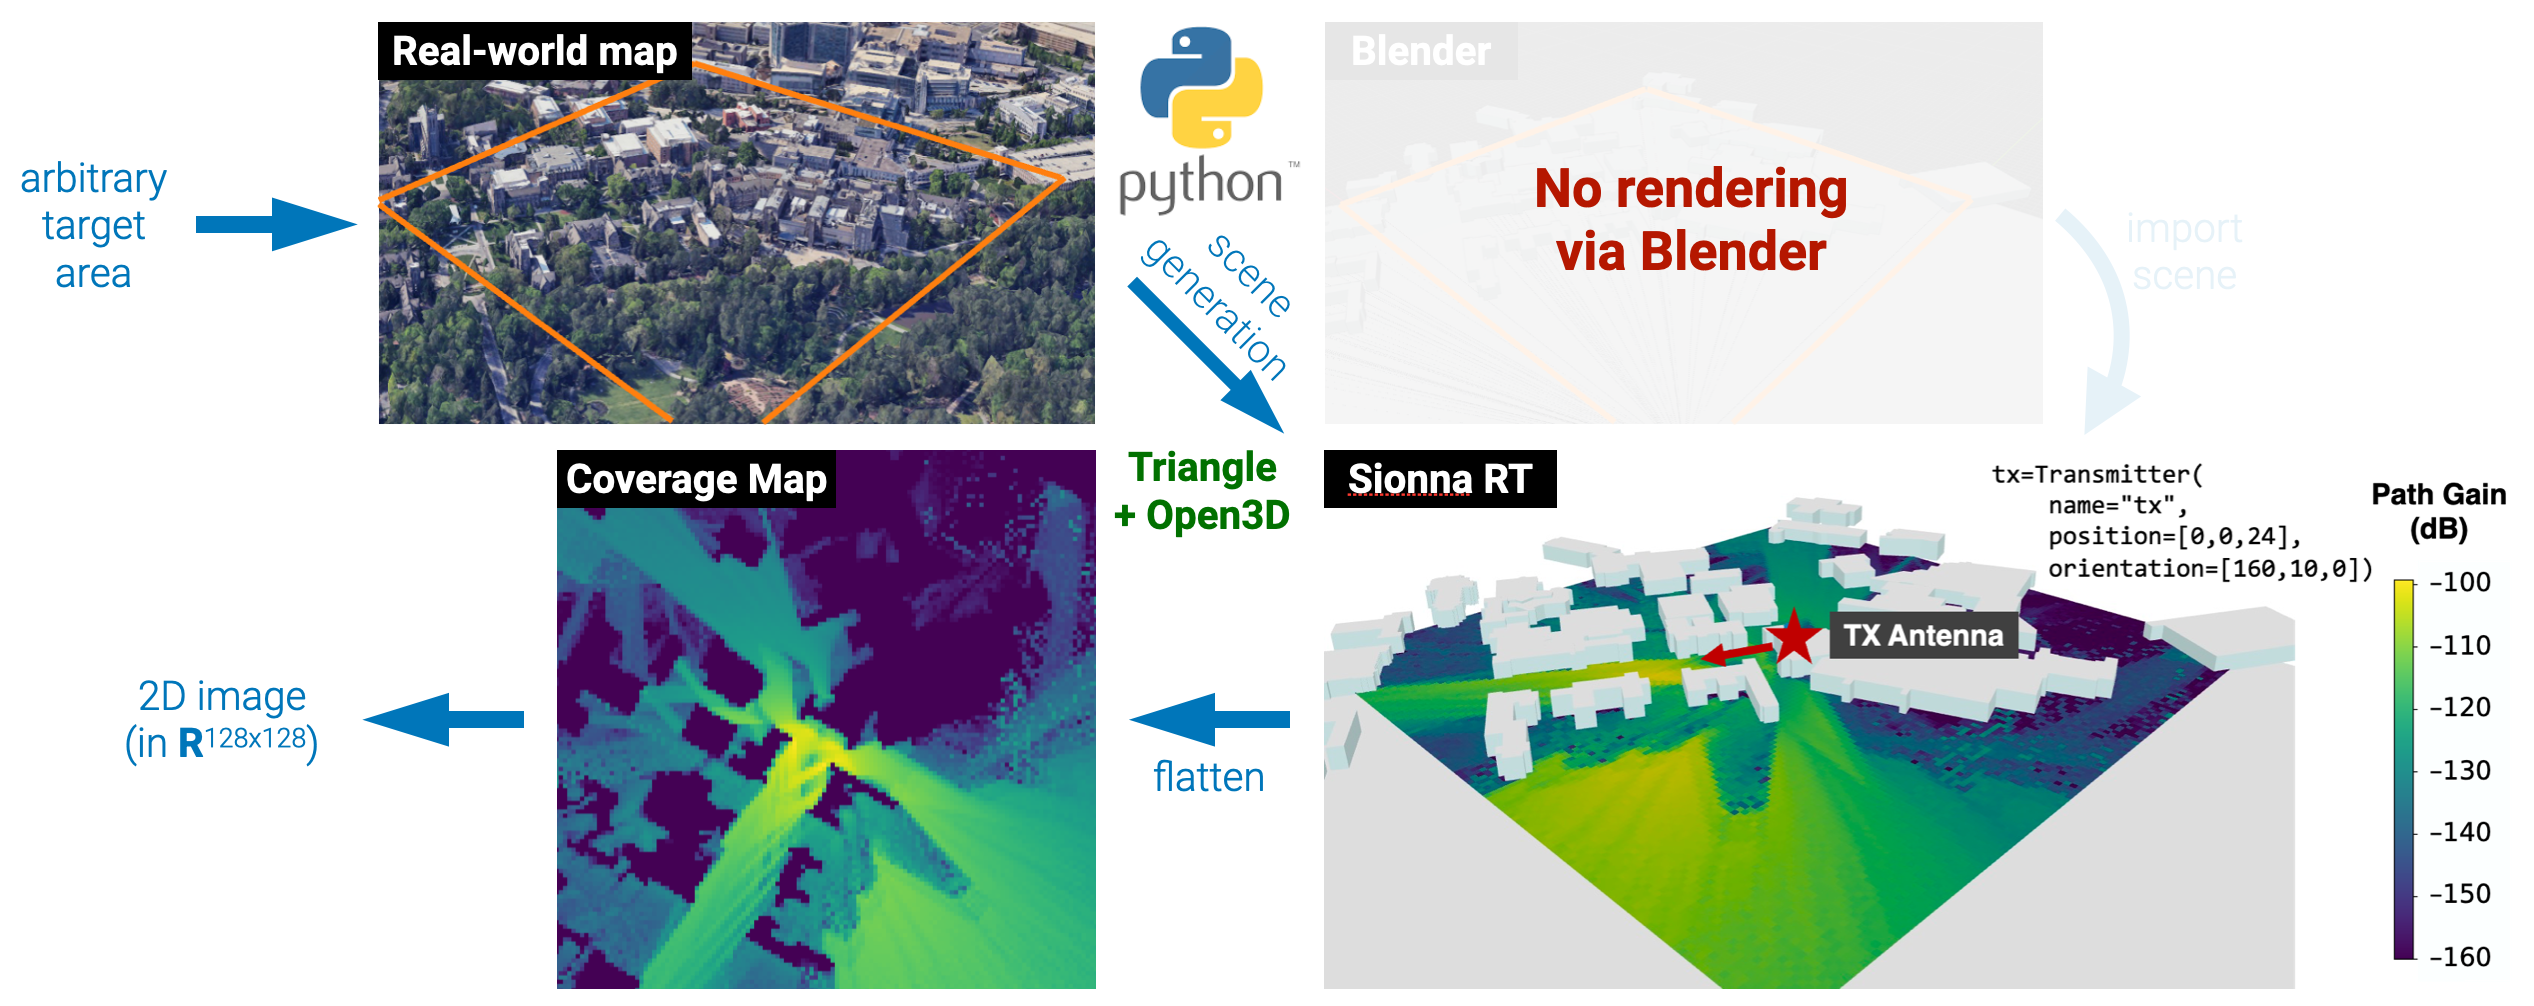
Geo2SigMap implements a scalable, pure Python-based 3D scene generation workflow (scene_gen) using Open3D and the OpenStreetMap (OSM) database. Through command line tools or Python APIs, one can easily scale up 3D scene generation for hundreds of thousands of arbitrary selected areas.
2. ML-based Signal Coverage Prediction using Sparse Measurements

Geo2SigMap achieves efficient and precise RF signal mapping via a cascaded U-Net architecture, which is composed of U-Net-Iso and U-Net-Dir for generating coarse path gain (PG) maps and fine-grained signal strength (SS) maps, respectively. Specifically, the first U-Net generates a PG map that embeds the environmental information, and the second U-Net further refines this process and generates the fine-grained SS map by incorporating directivity and link budget information, as well as an additional input of a sparsely sampled SS map sampled across the same area.
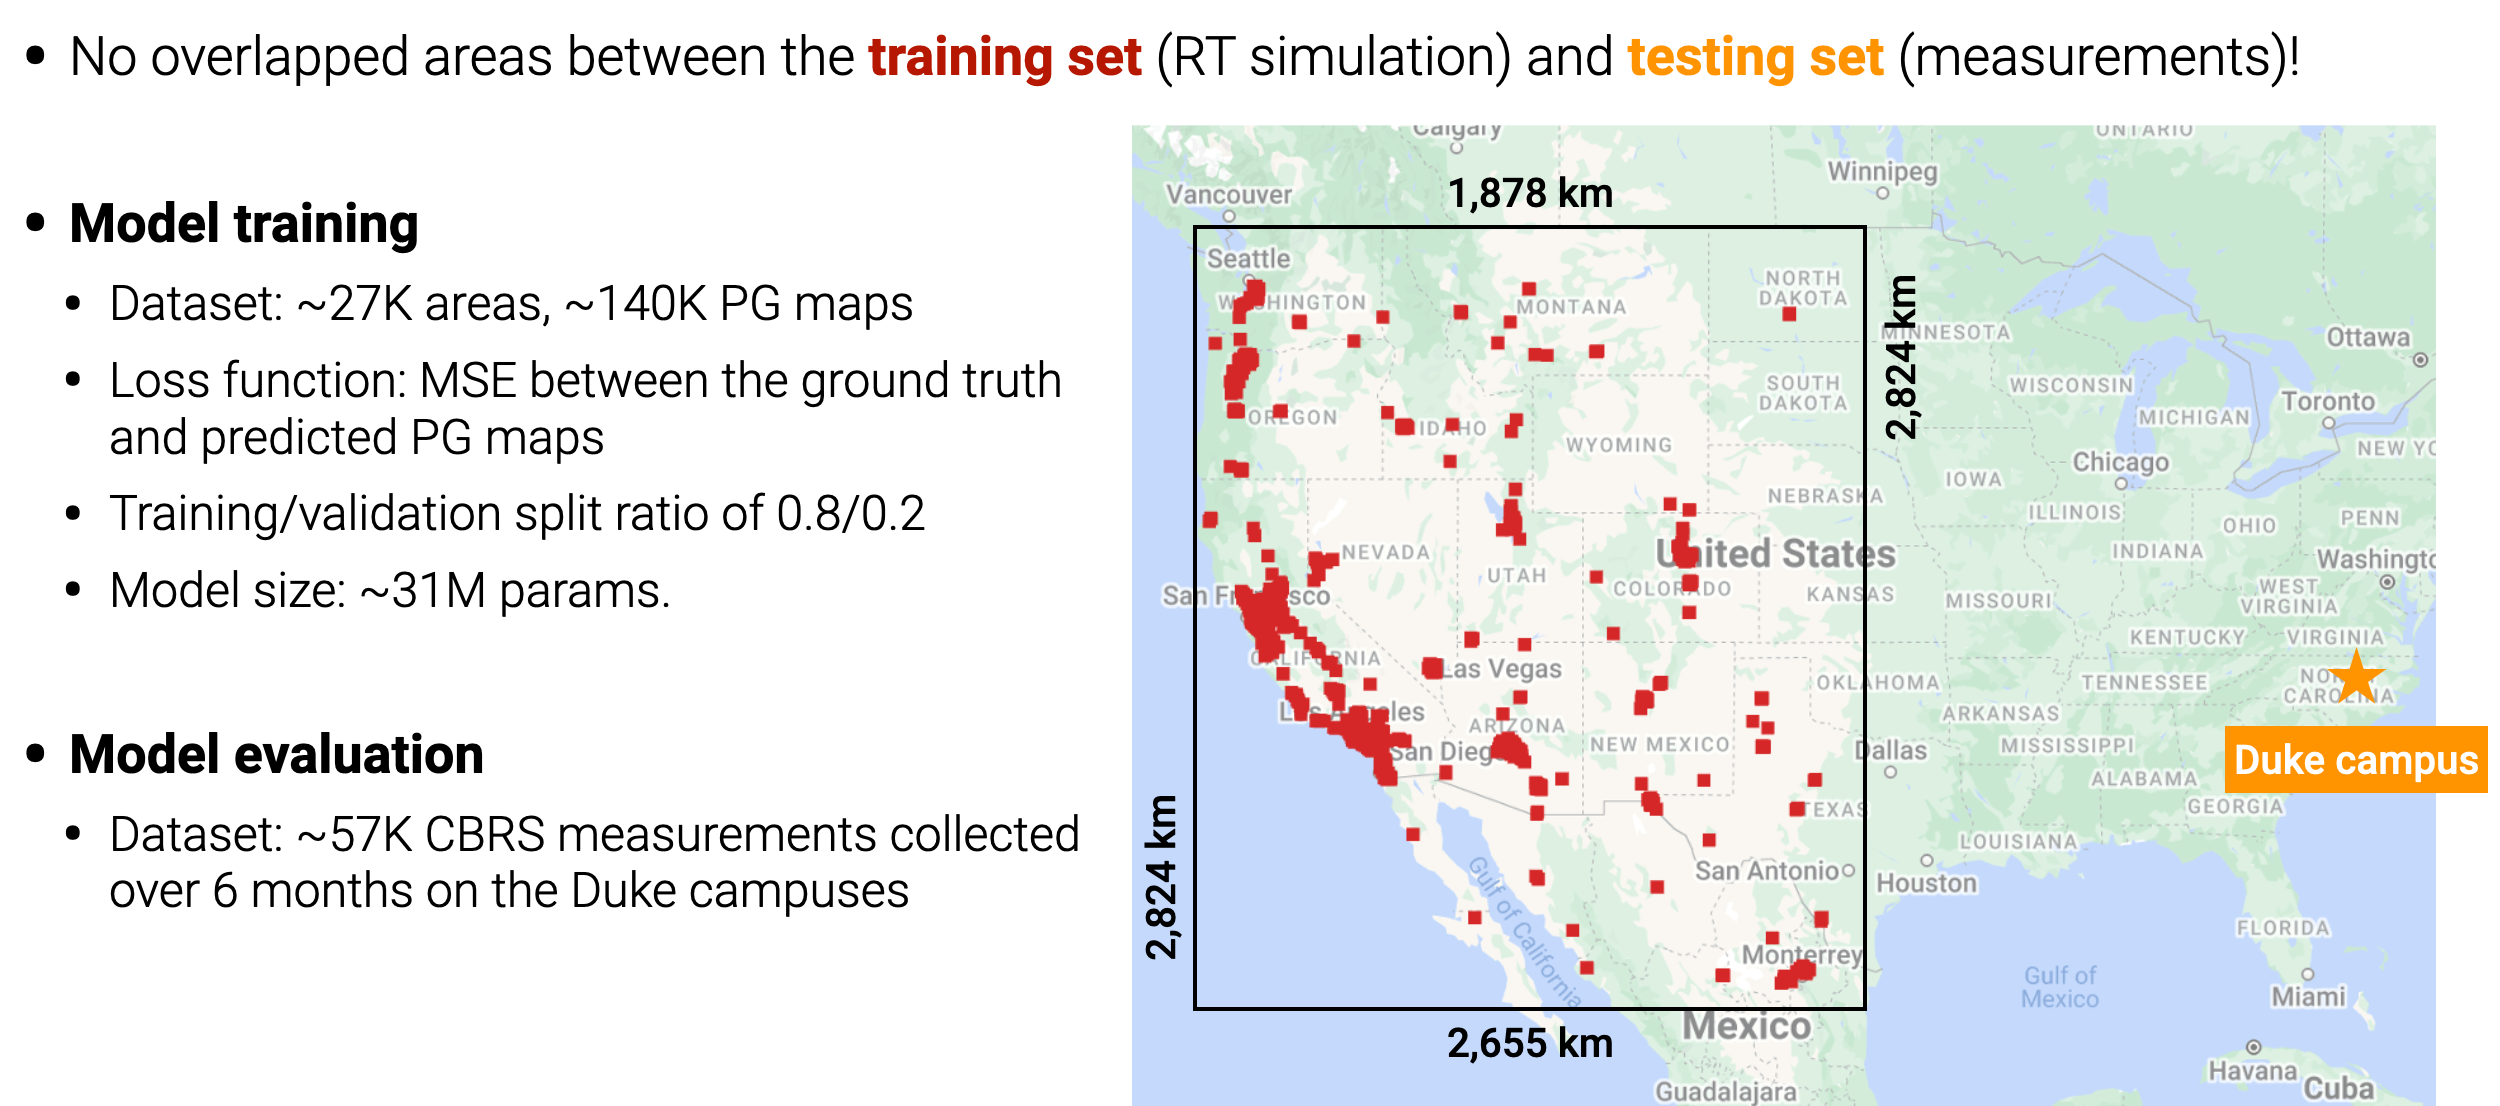
The model is trained on purely synthetic ray tracing data generated using our 3D scene generation workflow and NVIDIA's Sionna RT. Therefore, no real-world measurements are required during the training phase. The training set features a 6.41 million km^2 area in North America, from which a total number of 27,176 512m x 512m areas with a building-to-land ratio of at least 20% are selected to generate the building map and PG map datasets used to train the cascaded U-Net model. When the pre-trained model is employed to predict the detailed SS map for a specific area, we incorporate a few field measurements that serve as the sparse SS map input to the second U-Net. Such a design effectively streamlines the model's applicability across different areas and eliminates the need for retraining the entire model for different geographical settings.
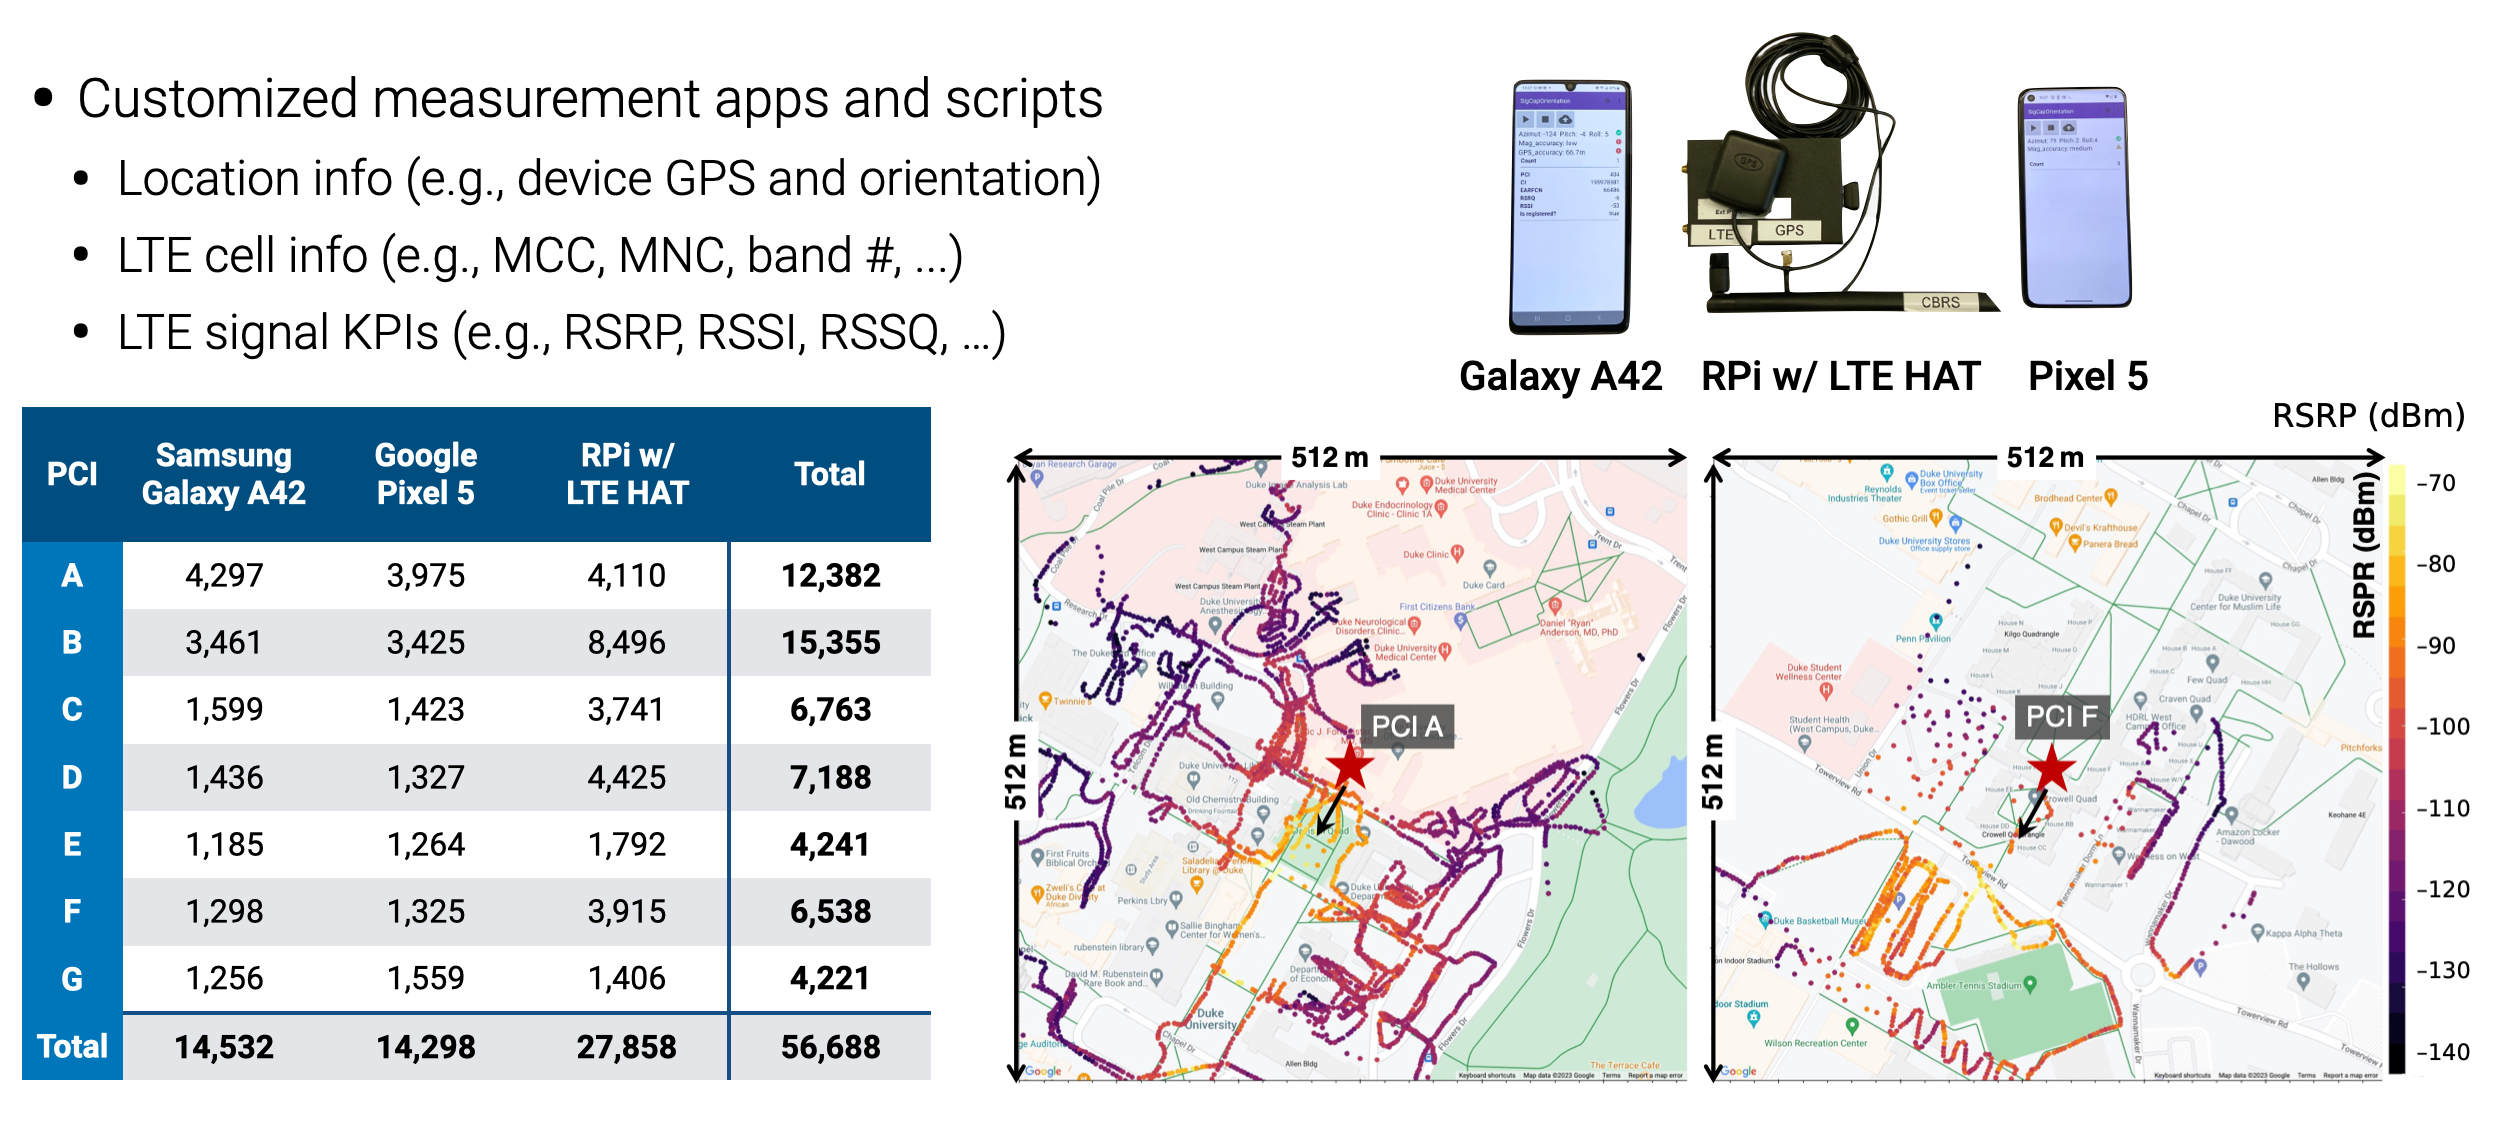
We evaluate the model performance via a real-world measurement campaign, where three types of UE collect cellular information from six LTE cells operating in the citizens broadband radio service (CBRS) band (3.55–3.7 GHz), deployed on the Duke University West Campus. Using customized Android apps and Python scripts, we collect over 45,000 measurements, each including various key cellular metrics such as the physical cell ID (PCI), reference signal received power (RSRP), and reference signal received quality (RSRQ).
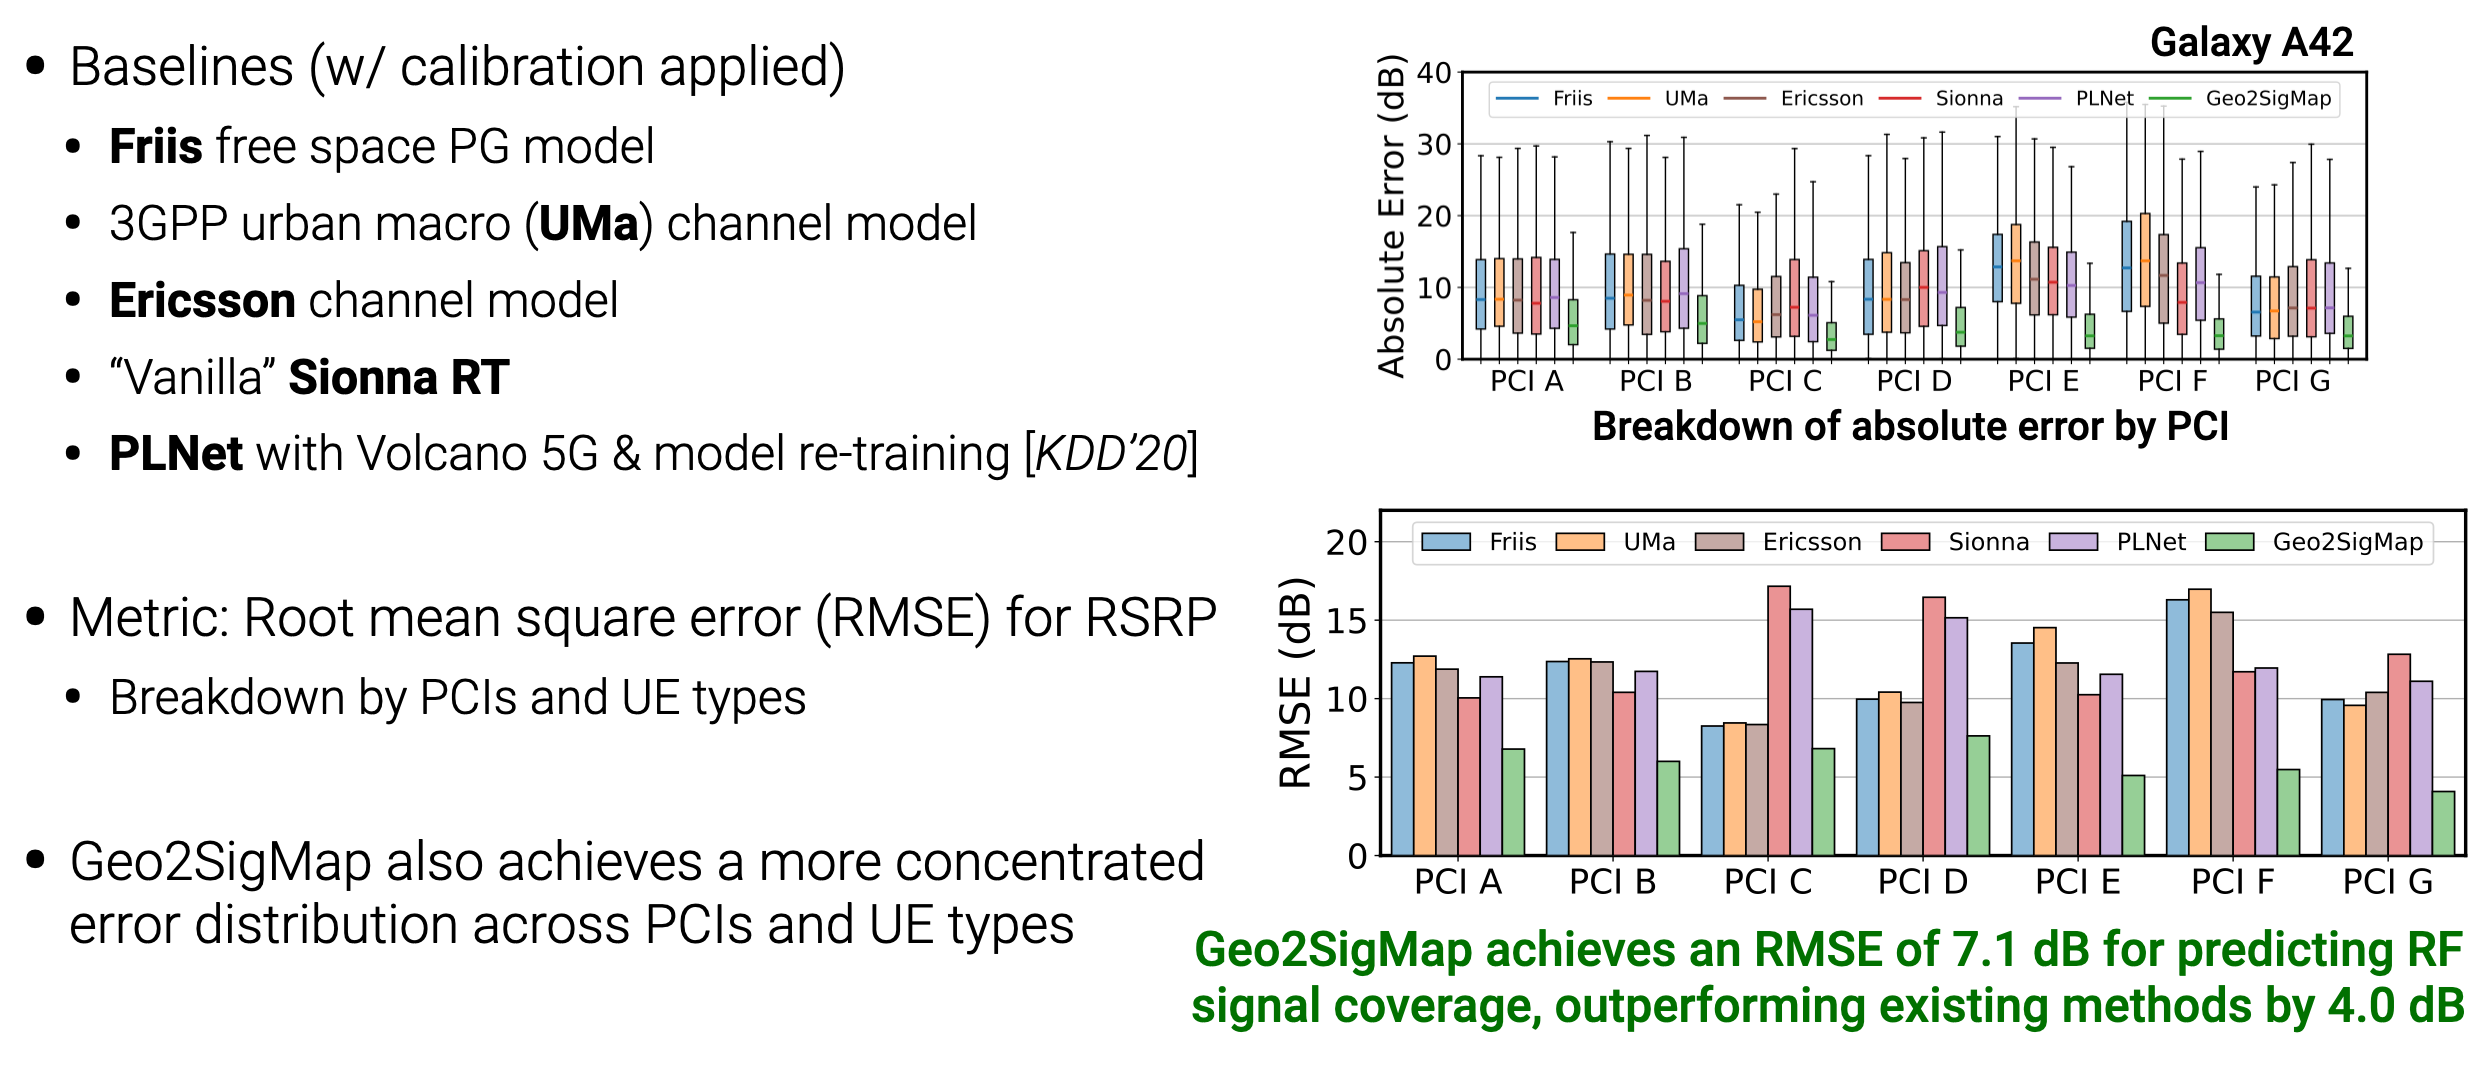
Evaluation results show that our model achieves an average root-mean-square-error (RMSE) of 6.04 dB for predicting the RSRP at the UE across the six LTE cells, representing an average improvement of 3.59 dB compared to existing RF signal mapping methods that rely on statistical channel models, ray tracing, and ML approaches.
3: Scalable 3D Scene Generation for Arbitrary Areas
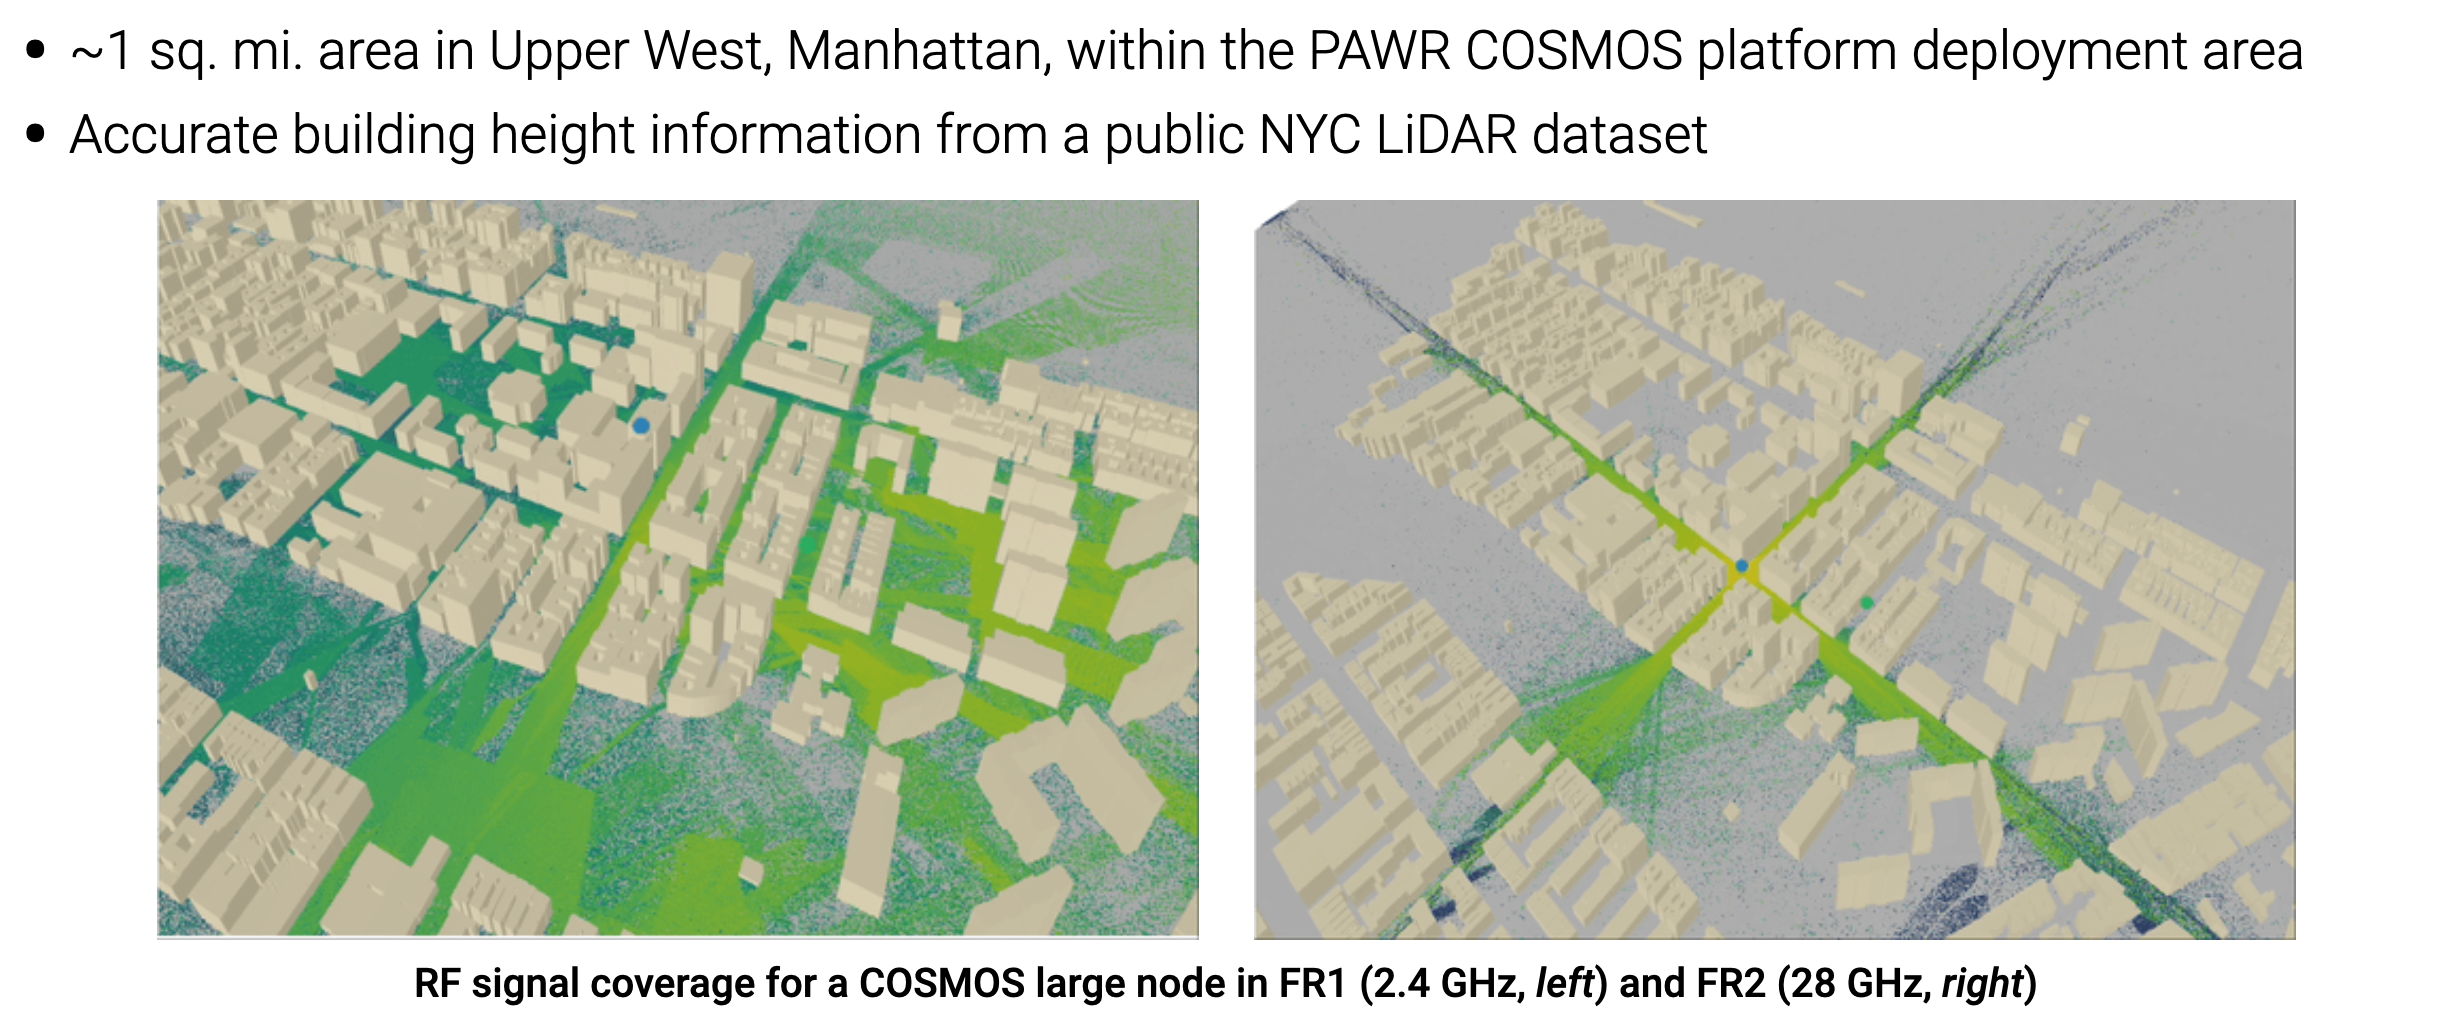
Our developed framework can be easily adapted to different areas. Shown above is an example of the developed wireless digital twin for the NSF PAWR COSMOS testbed area in the FCC Innovation Zone in West Harlem, NYC, where the coverage analysis is performed using Sionna RT in both FR1 (at 2.4 GHz) and FR2 (at 28 GHz) across the ~1 sq. mile area. For more examples, please refer to our tutorial Jupyter notebooks.
Acknowledgements
The work was carried out in the FuNCtions Lab at Duke University and supported in part by NSF grants CNS2112562, CNS-2128638, CNS-2211944, and AST-2232458, and an NVIDIA Academic Grant. We thank Joe Scarangella (RF Connect), and John Board, William Brockelsby, and Robert Johnson (Duke University) for their contributions to this work.
BibTeX
      @inproceedings{li2024geo2sigmap,
        title={Geo2SigMap: High-fidelity RF signal mapping using geographic databases},
        author={Li, Yiming and Li, Zeyu and Gao, Zhihui and Chen, Tingjun},
        booktitle={Proc. IEEE International Symposium on Dynamic Spectrum Access Networks (DySPAN'24)},
        year={2024}
      }